- Major-related courses
- /
- SICI4997
- /
- Python
Jupyter Notebook is a versatile tool that allows users to create interactive documents containing code, text, and visualizations, making it ideal for data analysis, and machine learning.
Problem
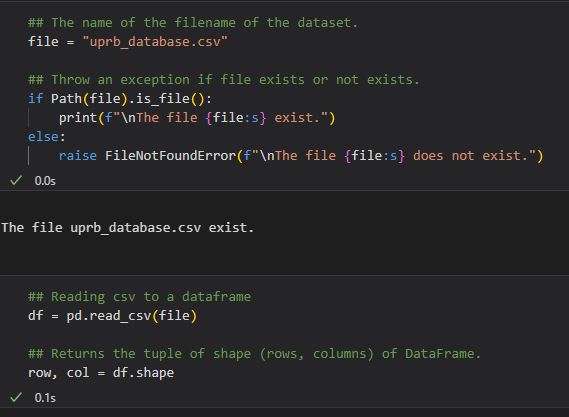
You create a database called UPRB_System has information related to each semester of the courses created. We have a file in uprb_database.csv. The information contains the teacher’s name, course code, section, name of the course, day and time it is offered, amount of credits, capacity, room and modality. The UPR Bayamon wants summarize all the information that they garther since 2017. Write a program in Python (modalityStudent.py) and R to answer the following questions.
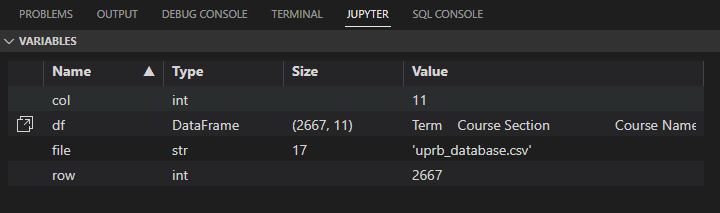
How to read a CSV file in Python and save the data in the dataframe?
Questions
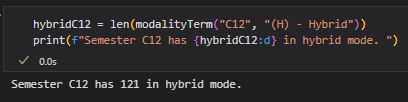
1. How many students are in the hybrid mode?
a. Term: C12
Semester C12 has in hybrid mode.
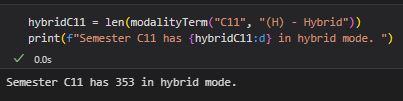
b. Term: C11
Semester C12 has in hybrid mode.
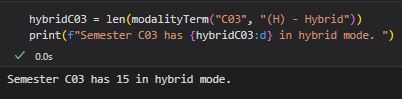
c. Term: C03
Semester C12 has in hybrid mode.
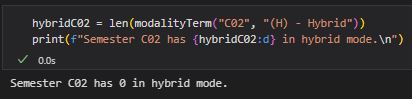
d. Term: C02
Semester C12 has in hybrid mode.
2. How many students are in the face-to-face mode?
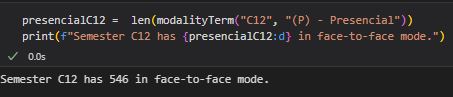
a. Term: C12
Semester C12 has in face-to-face mode.
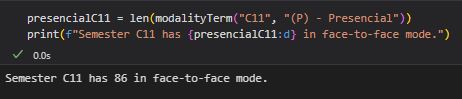
b. Term: C11
Semester C11 has in face-to-face mode.
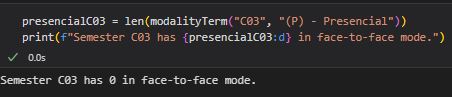
c. Term: C03
Semester C03 has in face-to-face mode.
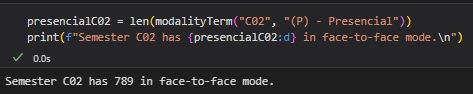
d. Term: C02
Semester C02 has in face-to-face mode.
3. How many students are in the distance mode?
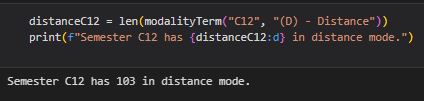
a. Term: C12
Semester C12 has in distance mode.
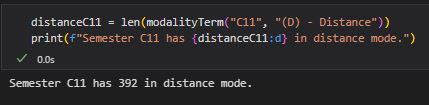
b. Term: C11
Semester C11 has in distance mode.
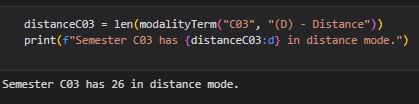
c. Term: C03
Semester C03 has in distance mode.
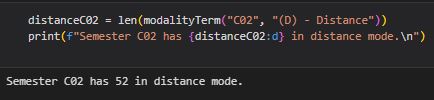
d. Term: C02
Semester C02 has in distance mode.
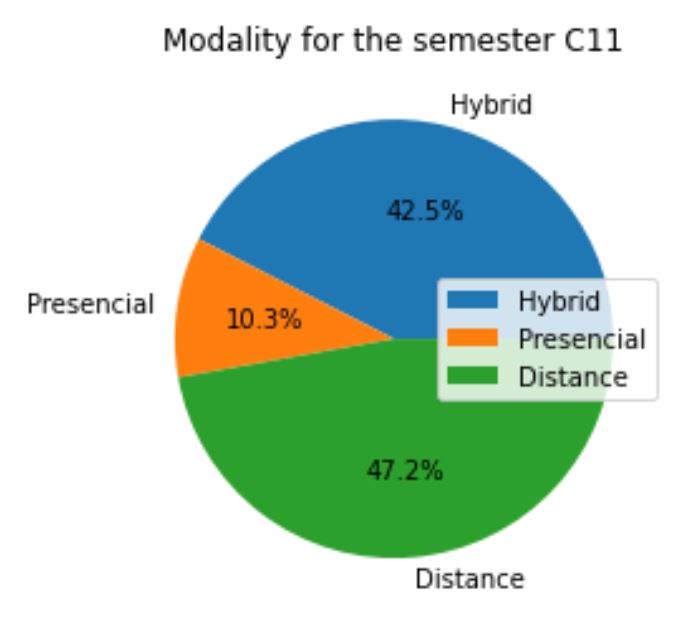
Example #1 - Pie Chart
How to generate Pie Chart in Python? To generate a pie chart in Python, you can use the matplotlib library. First, install it using pip install matplotlib, then use the plt.pie() function to create the chart by passing in your data and labels. Finally, display the chart with plt.show().
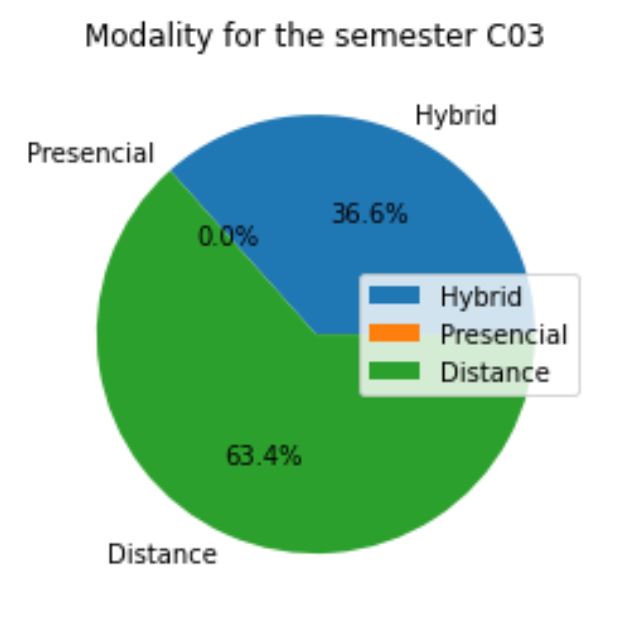
Example #2 - Pie Chart
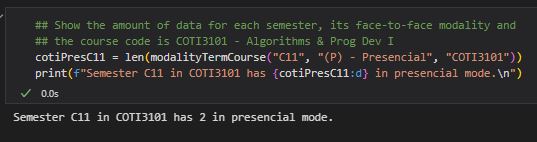
4. How many students of the code course COTI3101 course are face-to-face mode?
Semester C11 in COTI3101 has in distance mode.
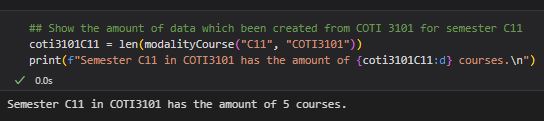
5. How many courses have been created from COTI3101 for semester C11?
Semester C11 in COTI3101 has the amount of courses.
6. How many courses have been created from SICI4036 course are hybrid?
This question was added recently from the dataset.
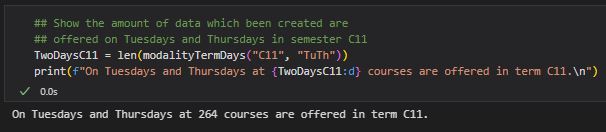
7. How many courses were offered on Tuesdays and Thursdays in semester C11?
On Tuesdays and Thursdays at courses are offered in term C11.
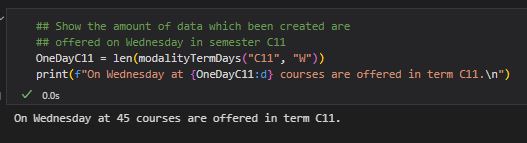
8. How many courses were offered on Wednesday in semester C11?
On Wednesday at courses are offered in term C11.
9. How many courses were offered in the semester?
C22: , C12: , C11: , C03: y C02:
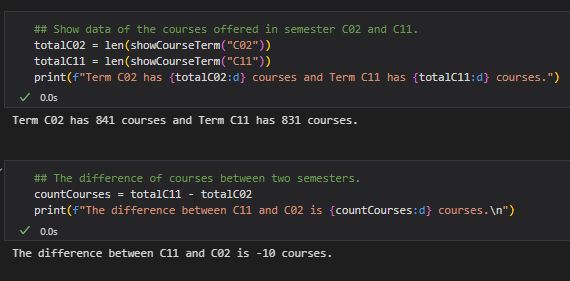
10. How many courses were offered in C02 and C11? How much was the difference?
Term C02 has courses and Term C11 has courses. The difference between C11 and C02 is courses.
Conclusion
Jupyter Notebooks and DataFrame Python libraries are tools for data analysis and machine learning. The notebook Juypter is interactively developing and presenting data science projects where users can write and run code, view data, and record their work. On the other hand, the python module DataFrame that allows users to create, edit, and analyze tabular data in efficient way. Overall, Jupyter Notebooks and module DataFrames where the tools that help users process data better. Both tools provide a versatile and powerful data analysis and exploration platform that can be used for everything from scientific research to business analytics.